Safety Observation
Safety Observation Dashboard
Objective:To fetch details of Safety Observation with various filters to have data in a more prescribed format.
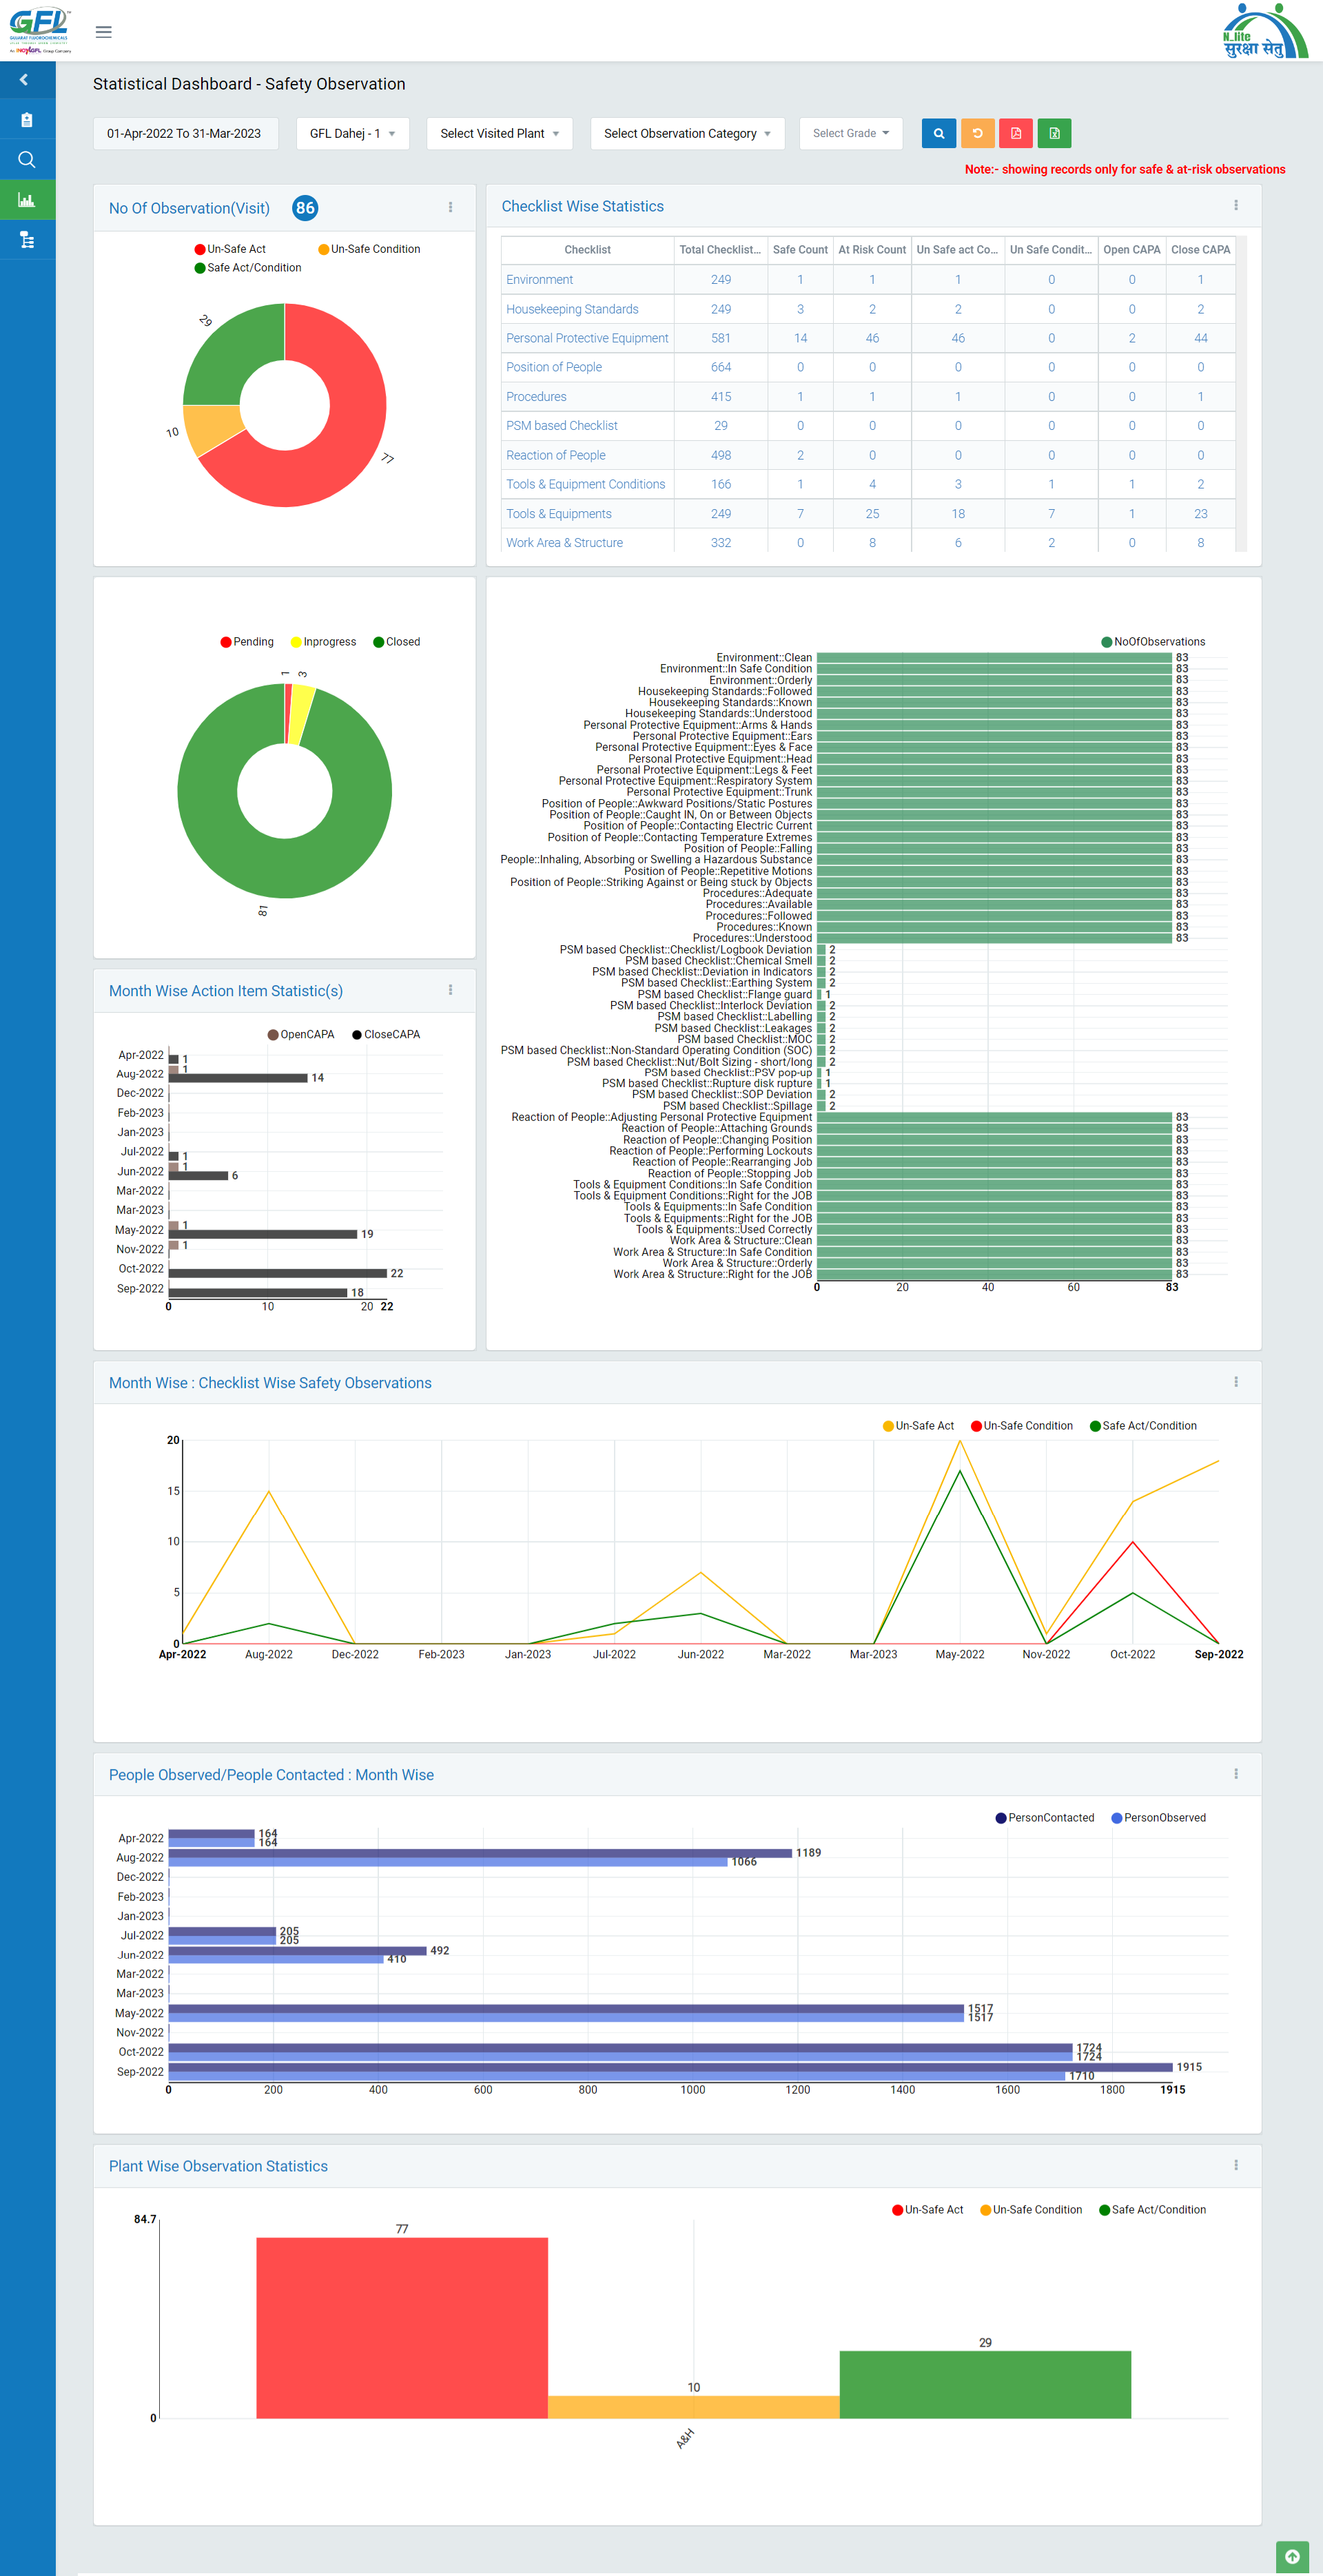
Statistical Dashboard

Image 1
- Login as the system user and select filters viz Timeline, Unit, Visited Plant,Observation category & Grade.
- Data in different format with details will be fetched.
- The Safety Observation details can be downloaded in Excel format by clicking Export to Excel button.
- There are various options available in terms of graphs viz- Column, Table, Bar, Donut, Line. User can select the graph type to generate the meeting data.
- The graph data can be downloaded in png with export to png.

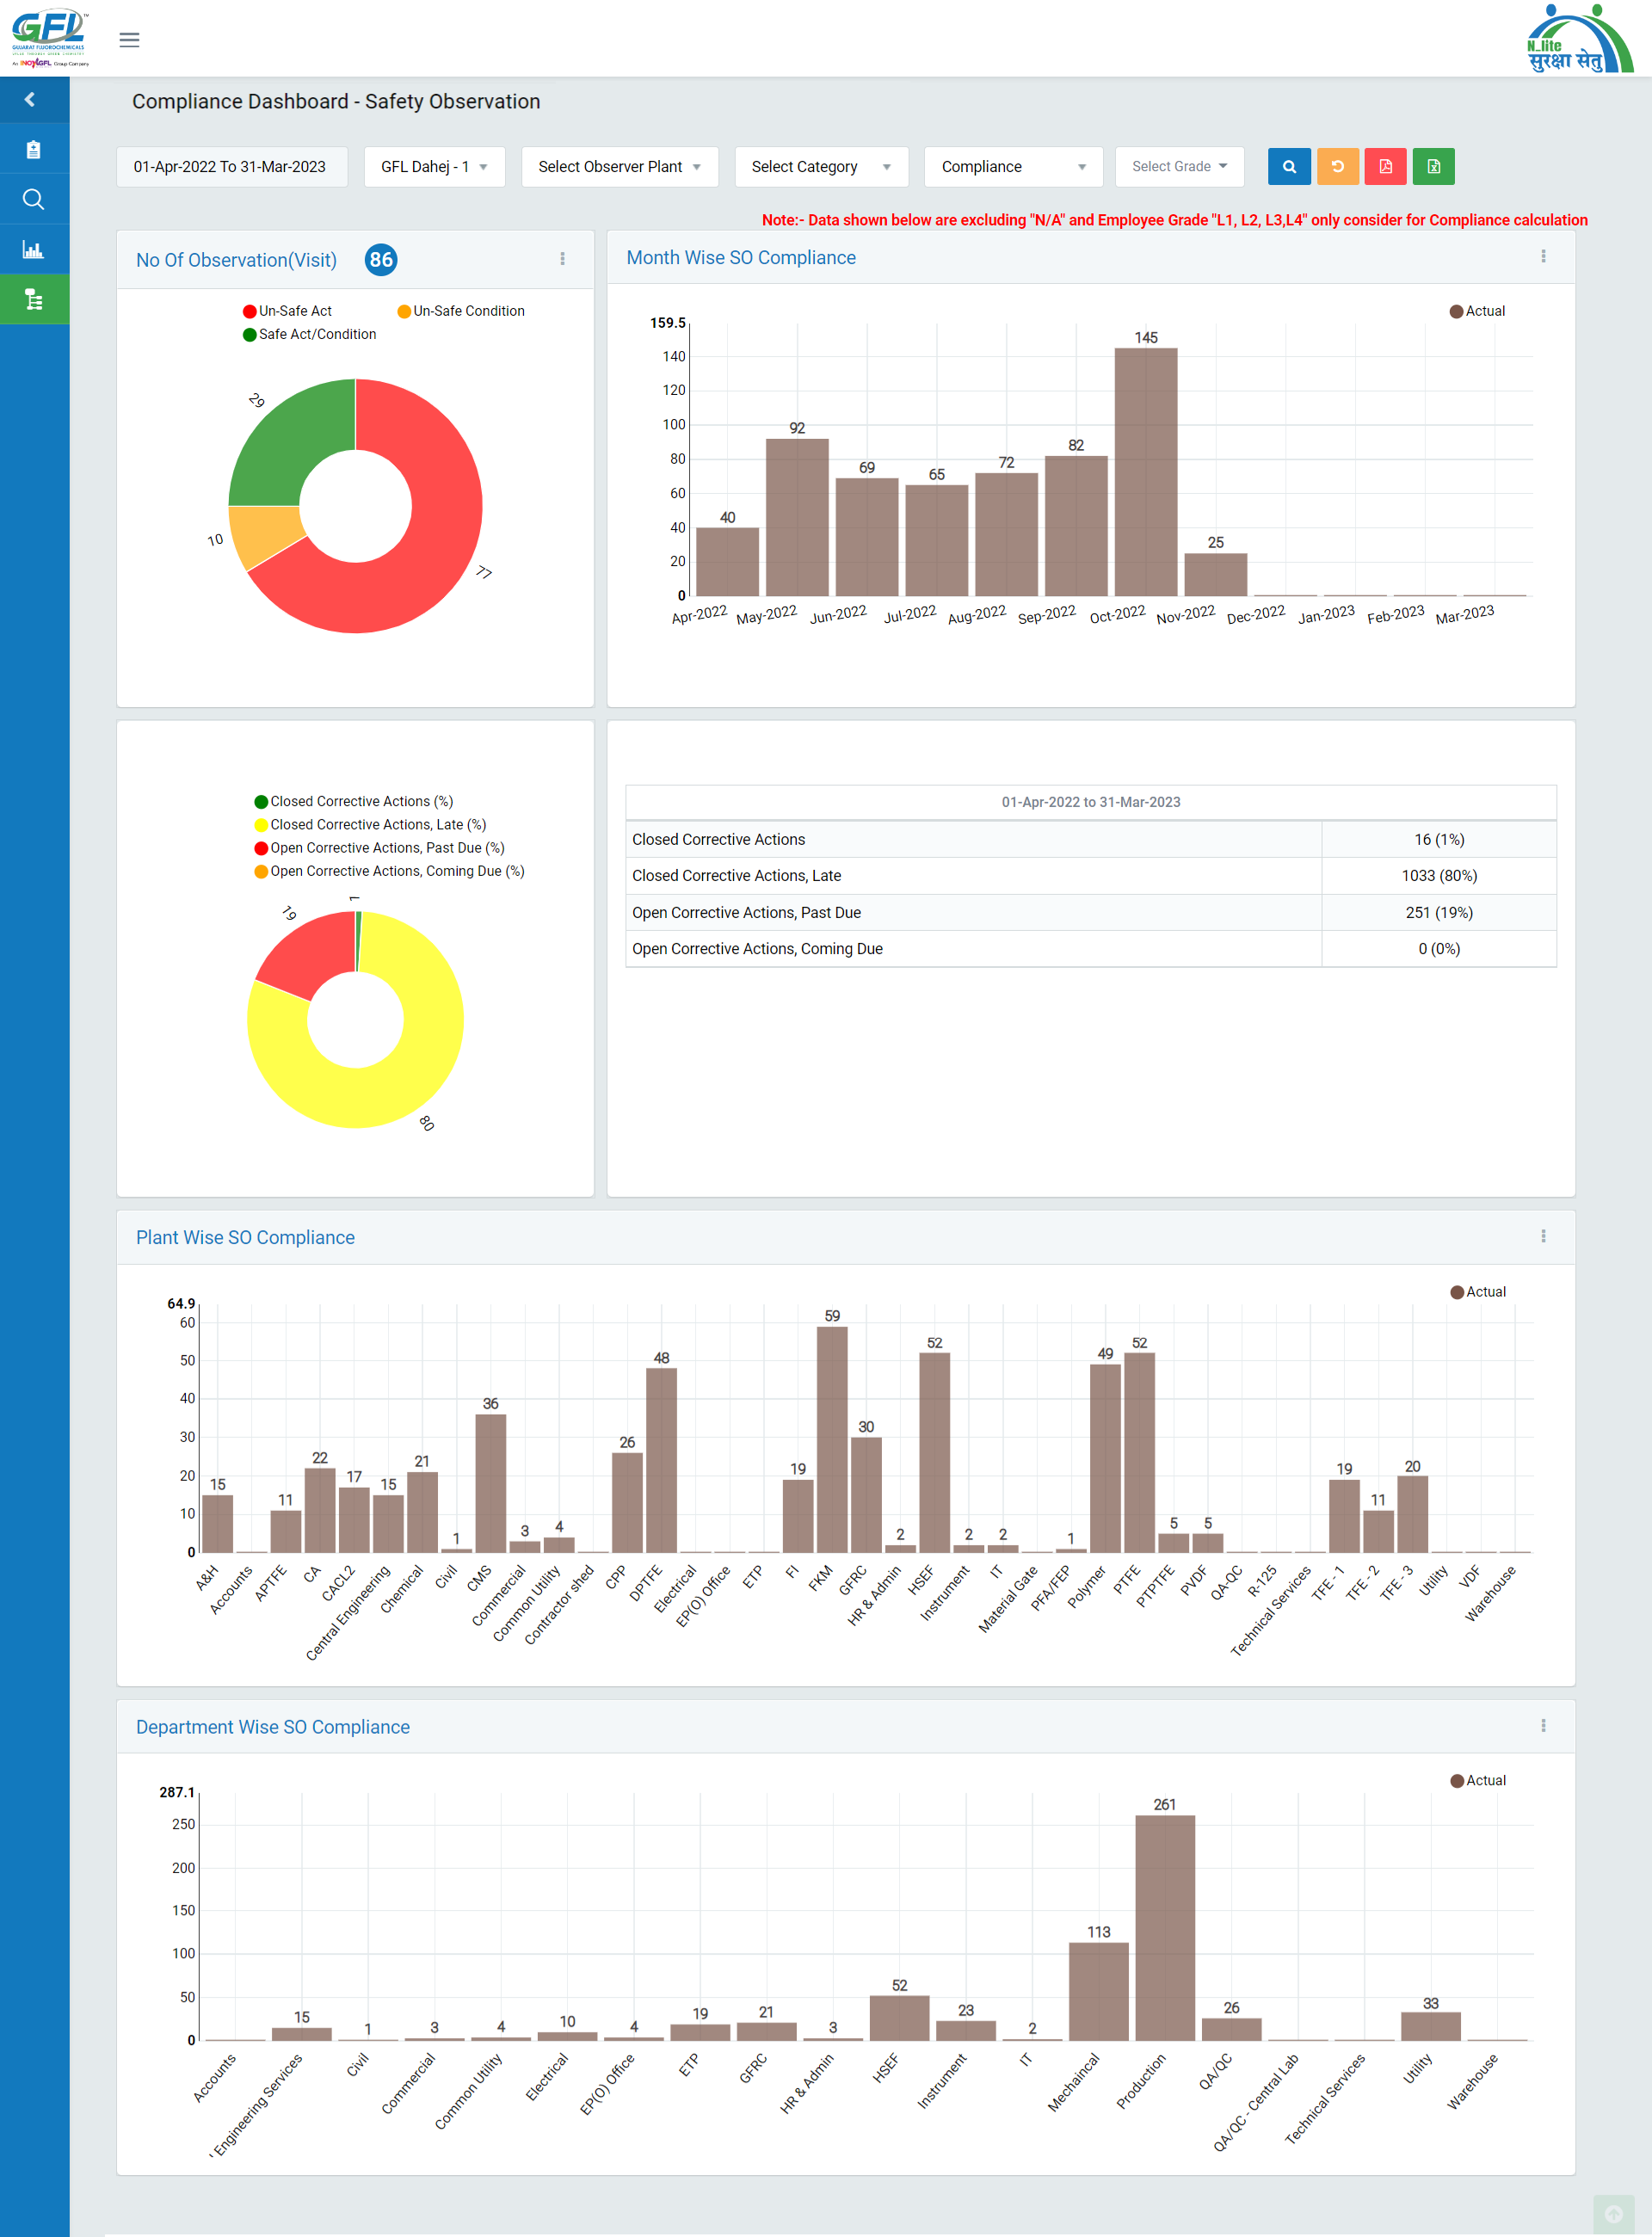
Image 2
- Safety Observation Dashboard will fetch details for Timeline, Unit , Observer Plant, Category & Compliance.
- Data for Month wise Safety Observation , Corrective Action Status, Plant wise Safety Observation will be populated.
- There are option to generate data in different formats viz Line, Bar, Donut, Table which can be selected by clicking on Three dots on right hand side of every graph.