Incident
Incident Dashboard
Objective:To fetch details of Incident with various filters to have data in a more prescribed format.
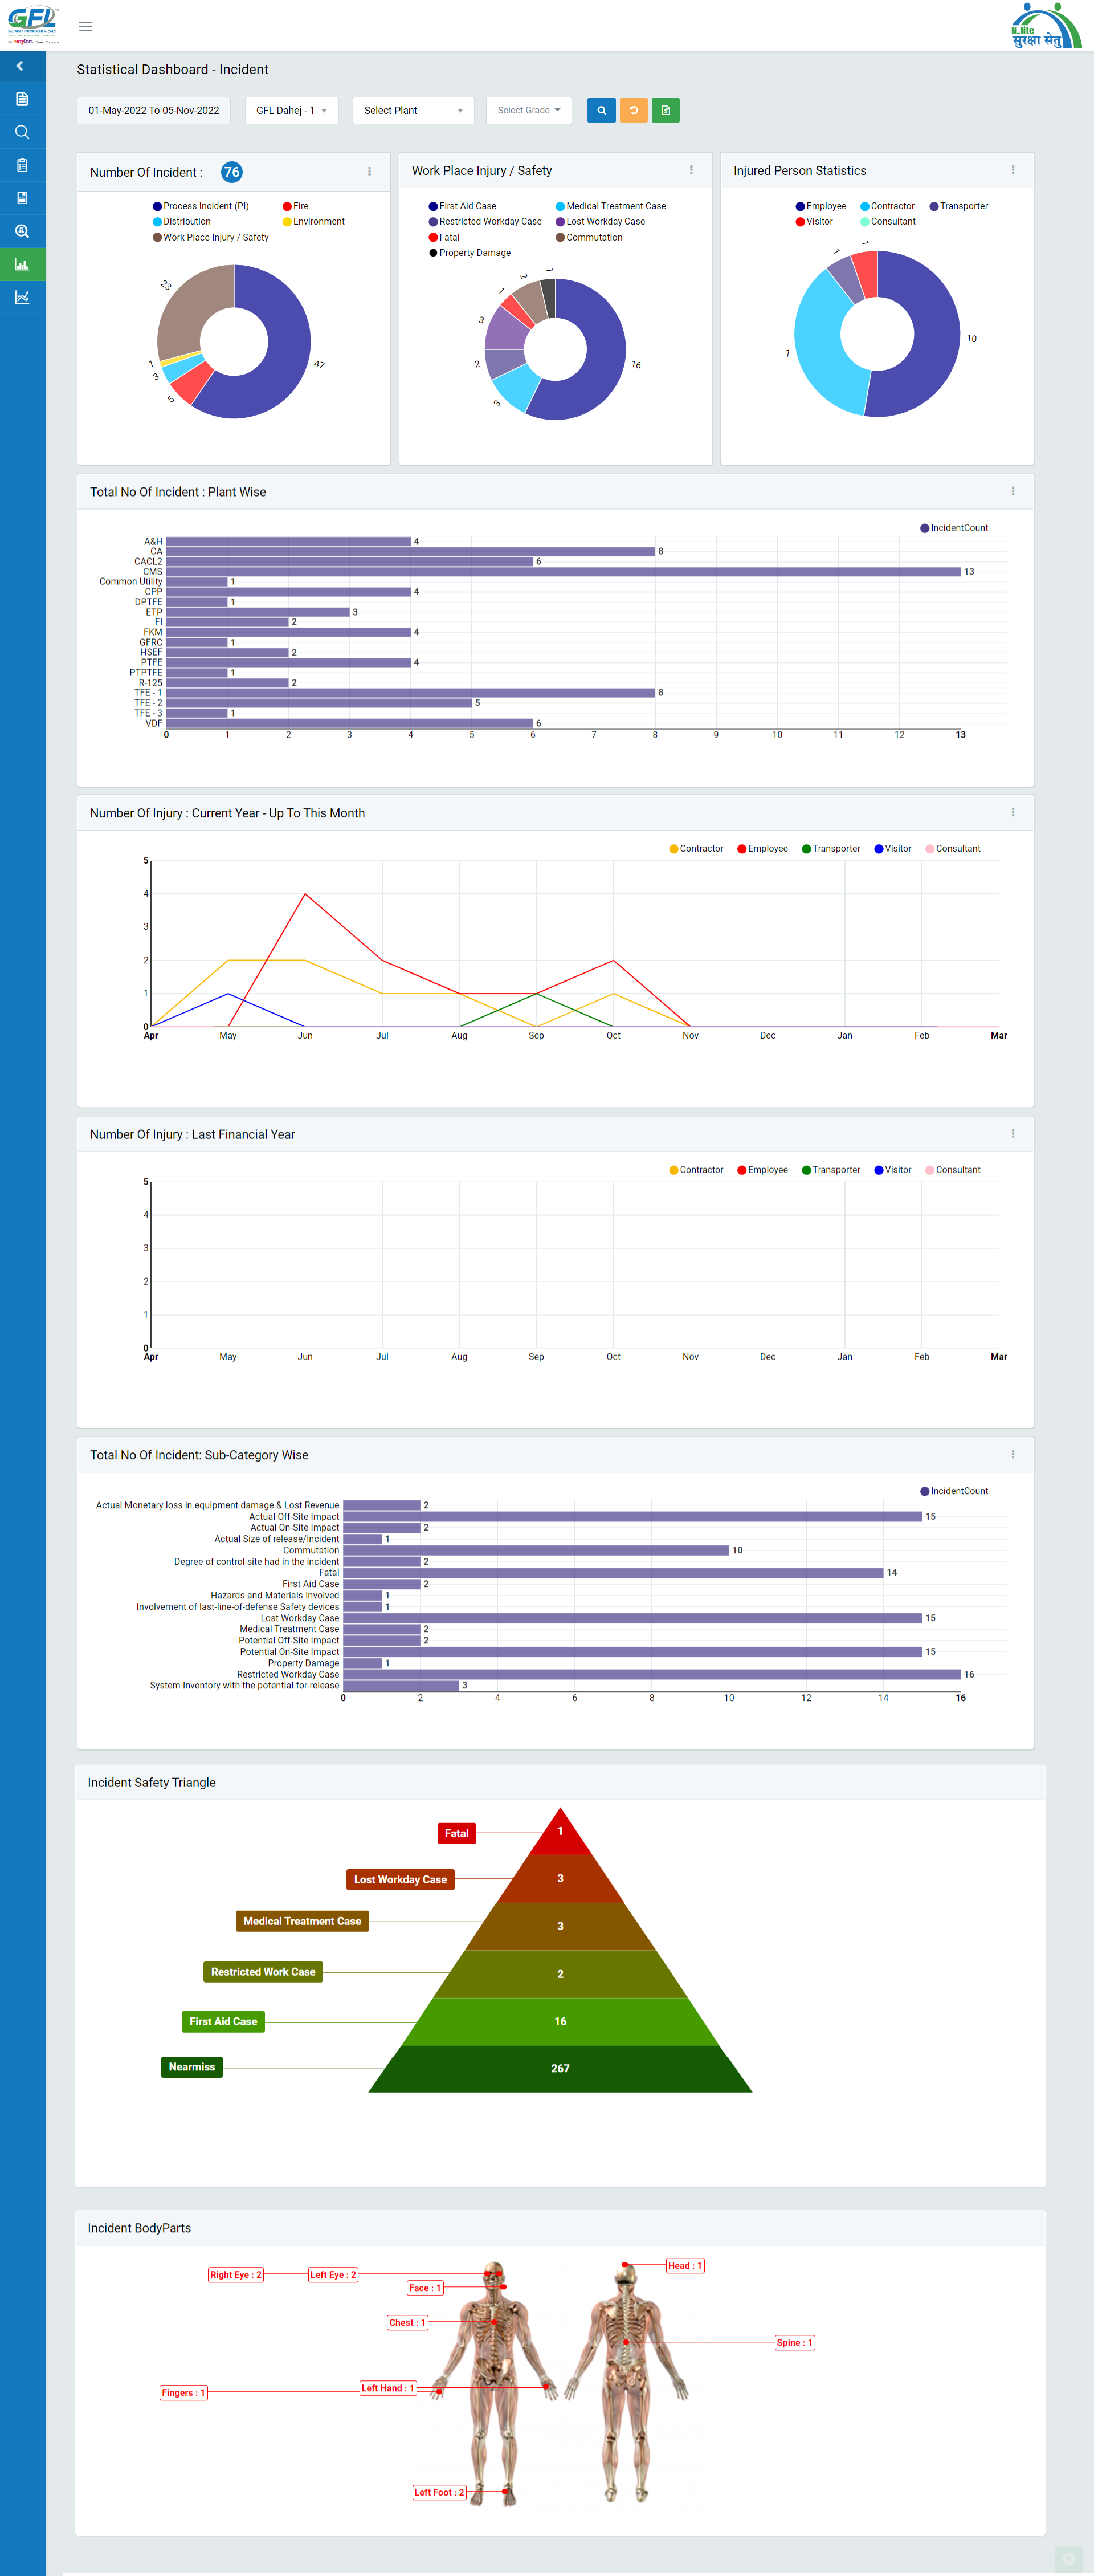
Statistical Dashboard

Image 1
- Login as the system user and select filters viz Timeline, Unit, Plant.
- Data in different format with details will be fetched.
- The Near-Miss details can be downloaded in Excel format by clicking Export to Excel button.
- There are various options available in terms of graphs viz- Column, Table, Bar, Donut, Line. User can select the graph type to generate the meeting data.
- The graph data can be downloaded in png with export to png.

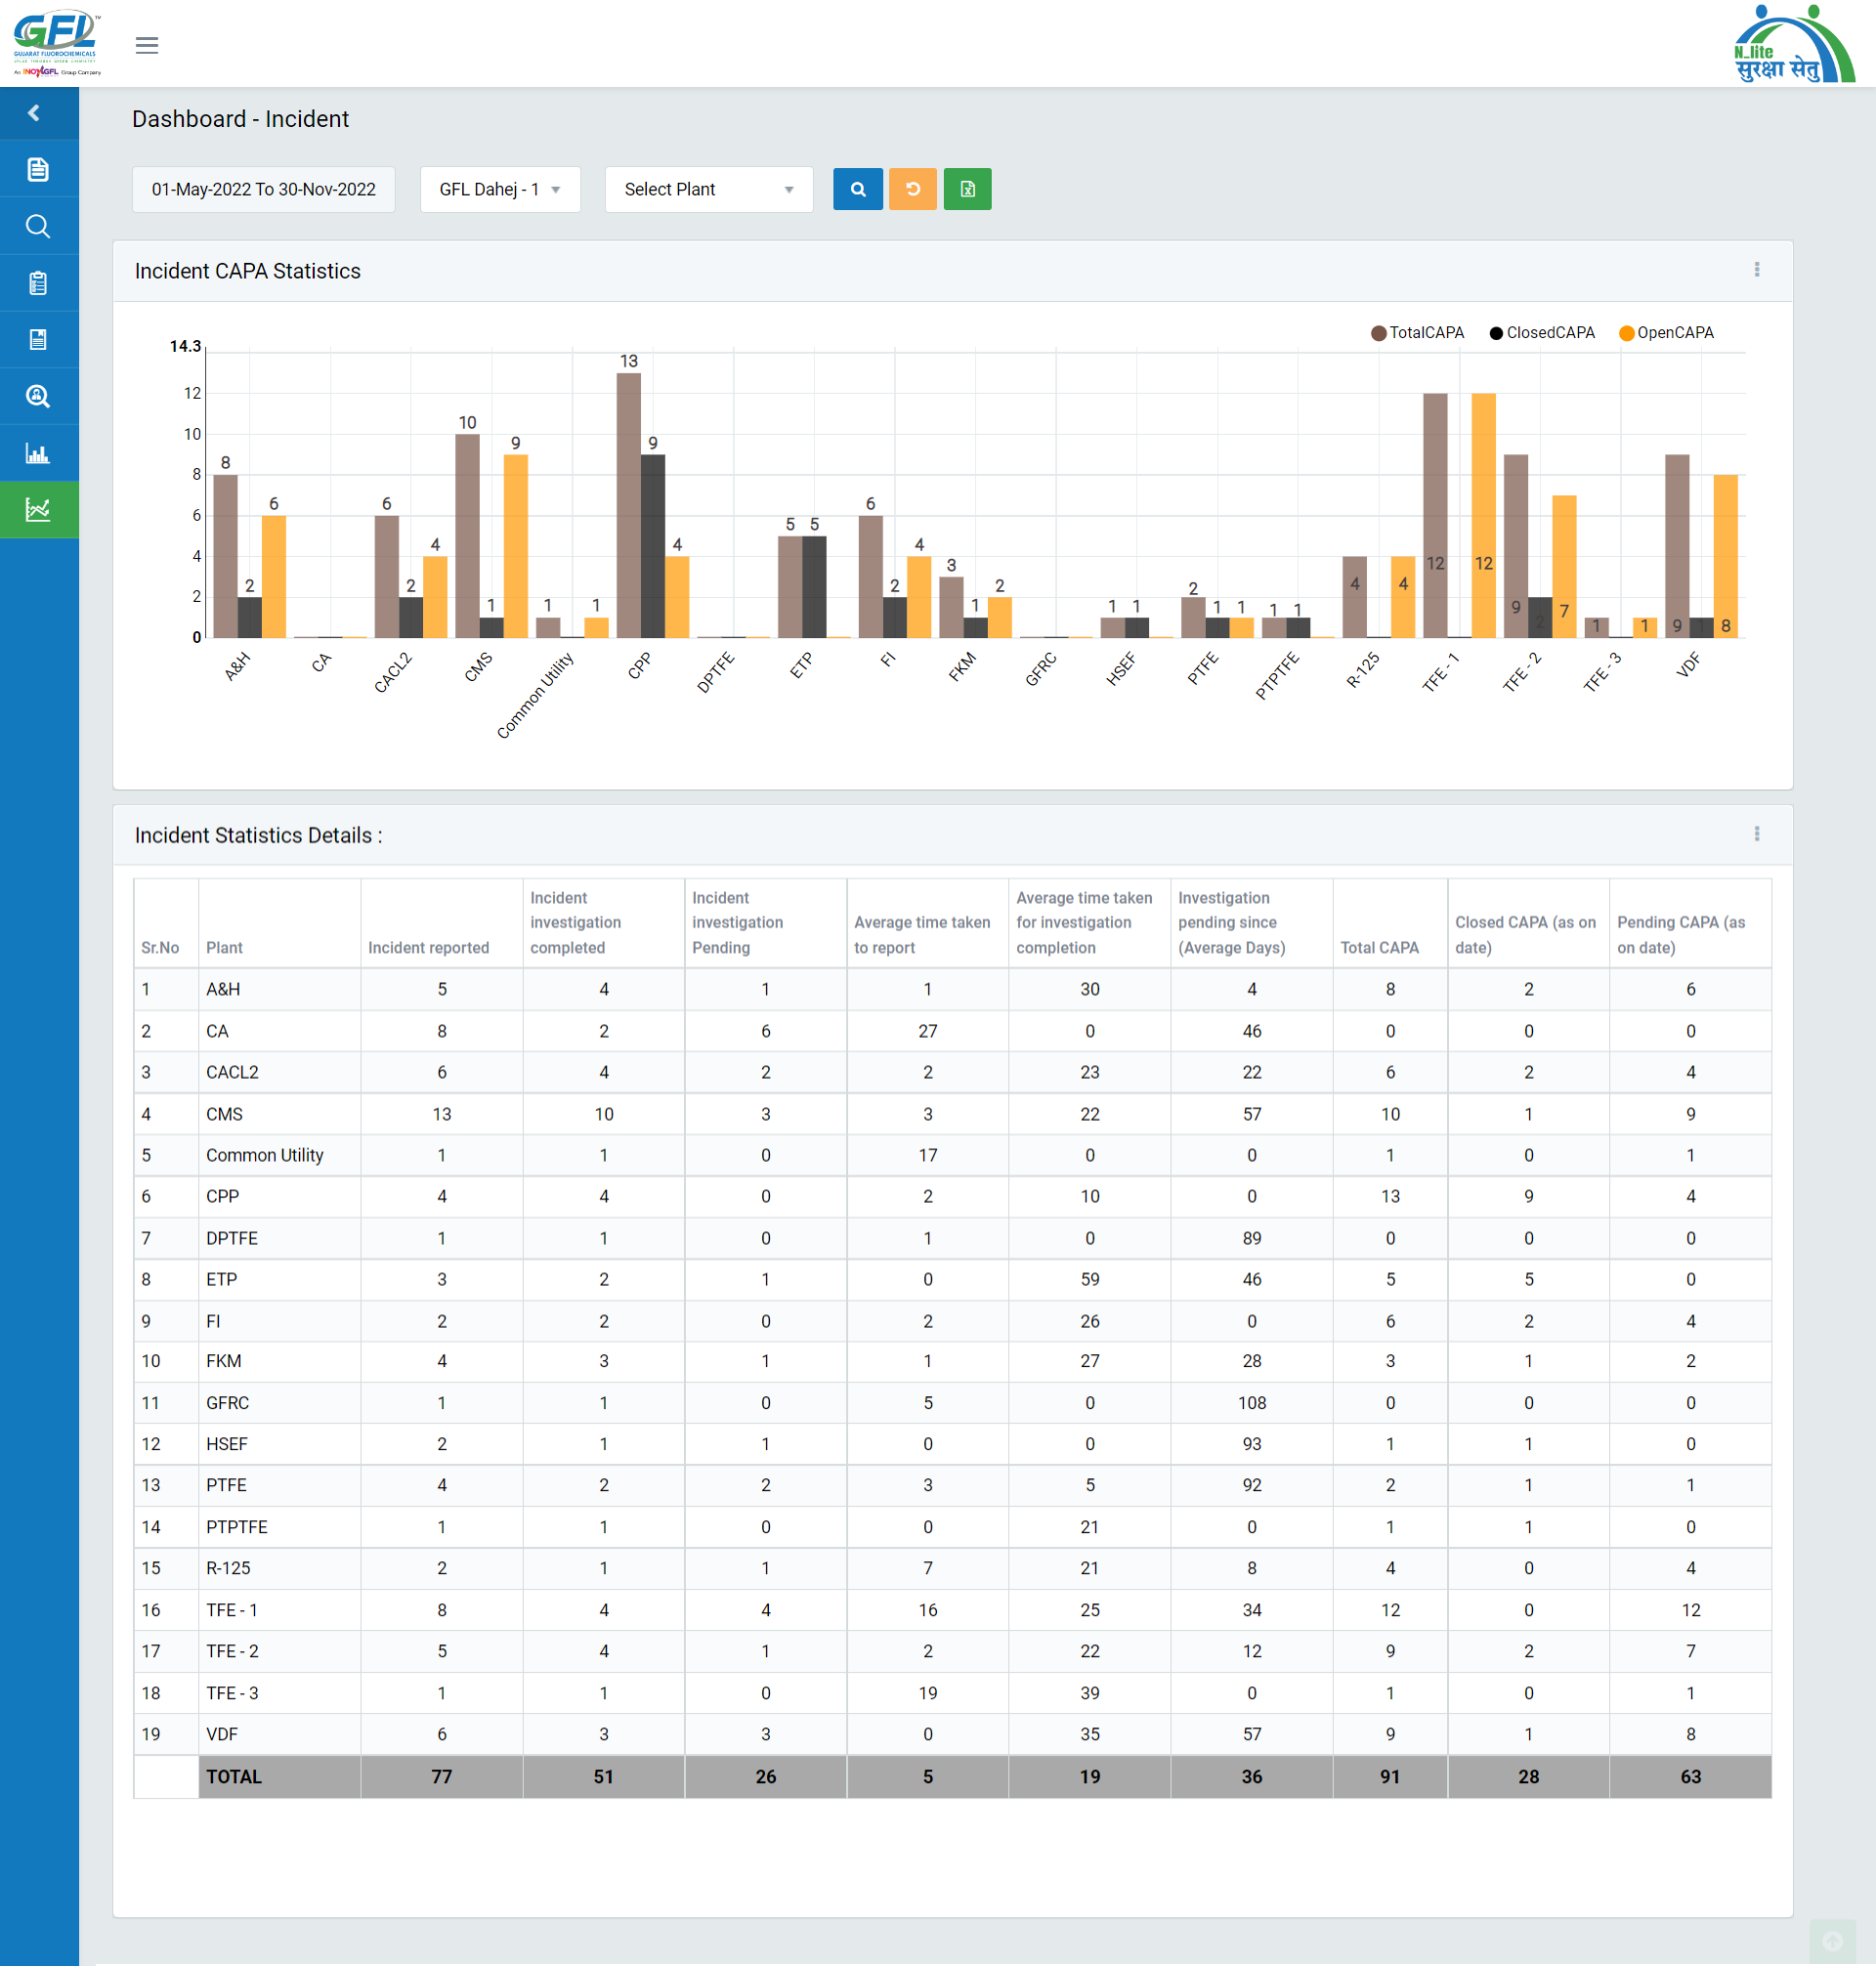
Image 2
- Incident Dashboard will fetch details for Timeline, Unit , Plant.
- Data in different format with details will be fetched.
- The Incident CAPA Statistical details can be downloaded in Excel format by clicking Export to Excel button.