Dashboard
Corporate Dashboard
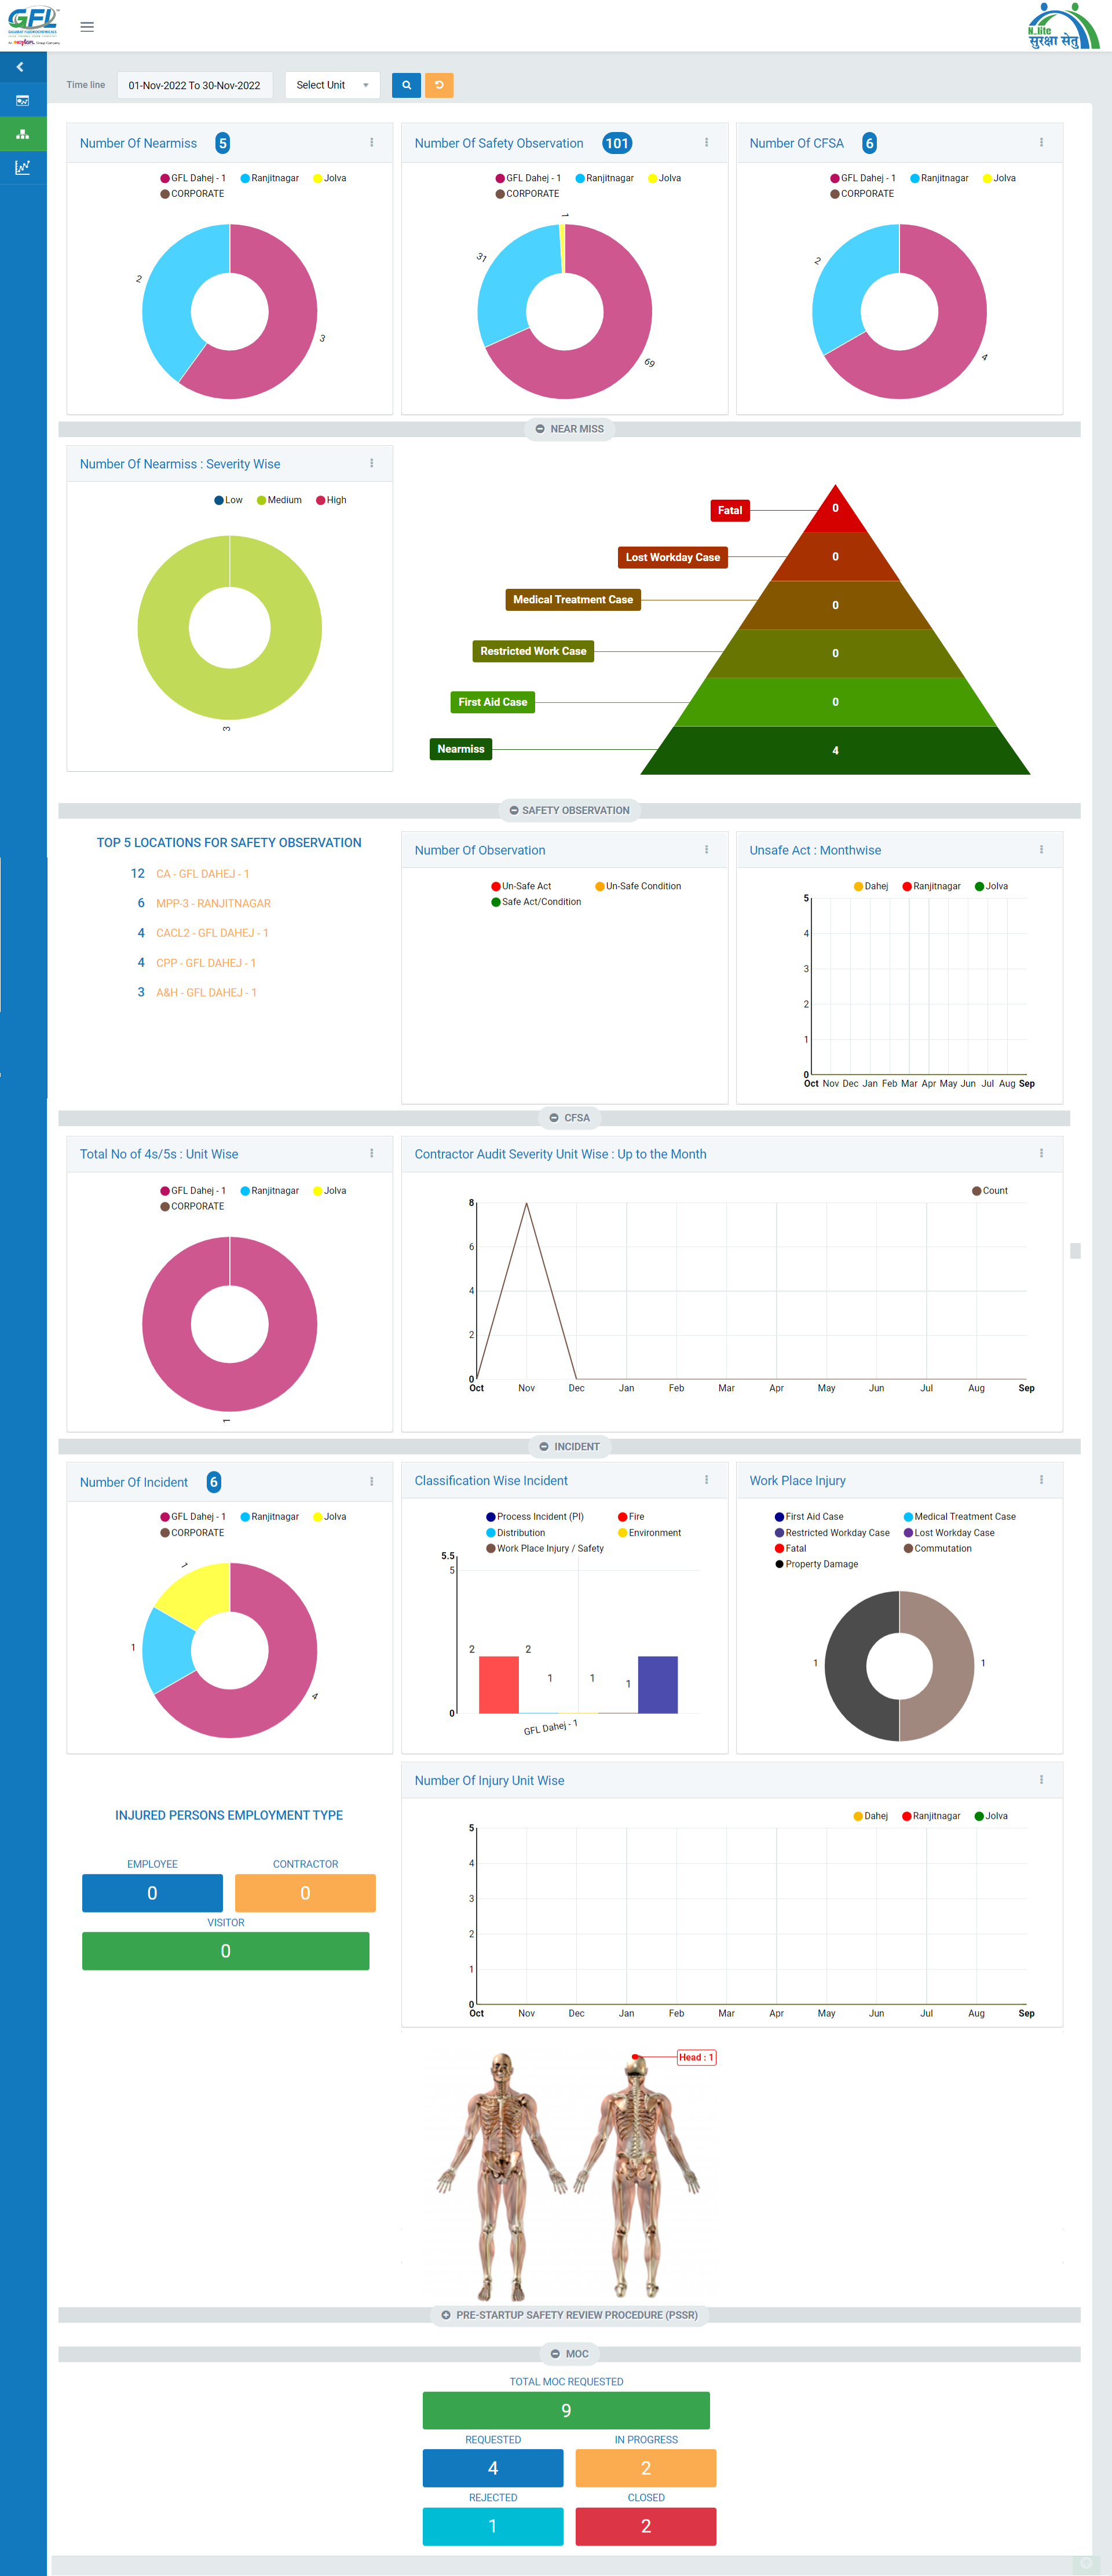
Objective:To fetch details of all Modules for all Units with various filters to have data in a more prescribed format.

Image 1
- Login as the Corporate User and select filters viz Timeline, Unit.
- Data in different format with details will be fetched.
- There are various options available in terms of graphs viz- Column, Table, Bar, Donut, Line. User can select the graph type to generate the meeting data.
- The graph data can be downloaded in png with export to png.
- The populated are clickable and can be used to more narrow down the data.