CSFA
CFSA Dashboard
Objective: To fetch details of CFSA with various filters to have data in a more prescribed format.
Statistical Dashboard

Image 1
- Login as the system user and select filters viz Timeline, Unit, Plant & Grade.
- Data in different format with details will be fetched.
- The CFSA details can be downloaded in Excel format by clicking Export to Excel button.
- The data will be fetched as No of CFSA Planned, No of CFSA , Total Good Citizens, Total Violators, Total no of Violators (4 &5), Total Violations, Average Severity for current Month, Average Severity for Last Month, Average Severity Current Month, Average Severity Last Year.
- There are various options available in terms of graphs viz- Column, Table, Bar, Donut, Line. User can select the graph type to generate the meeting data.
- The graph data can be downloaded in png with export to png.

Image 2
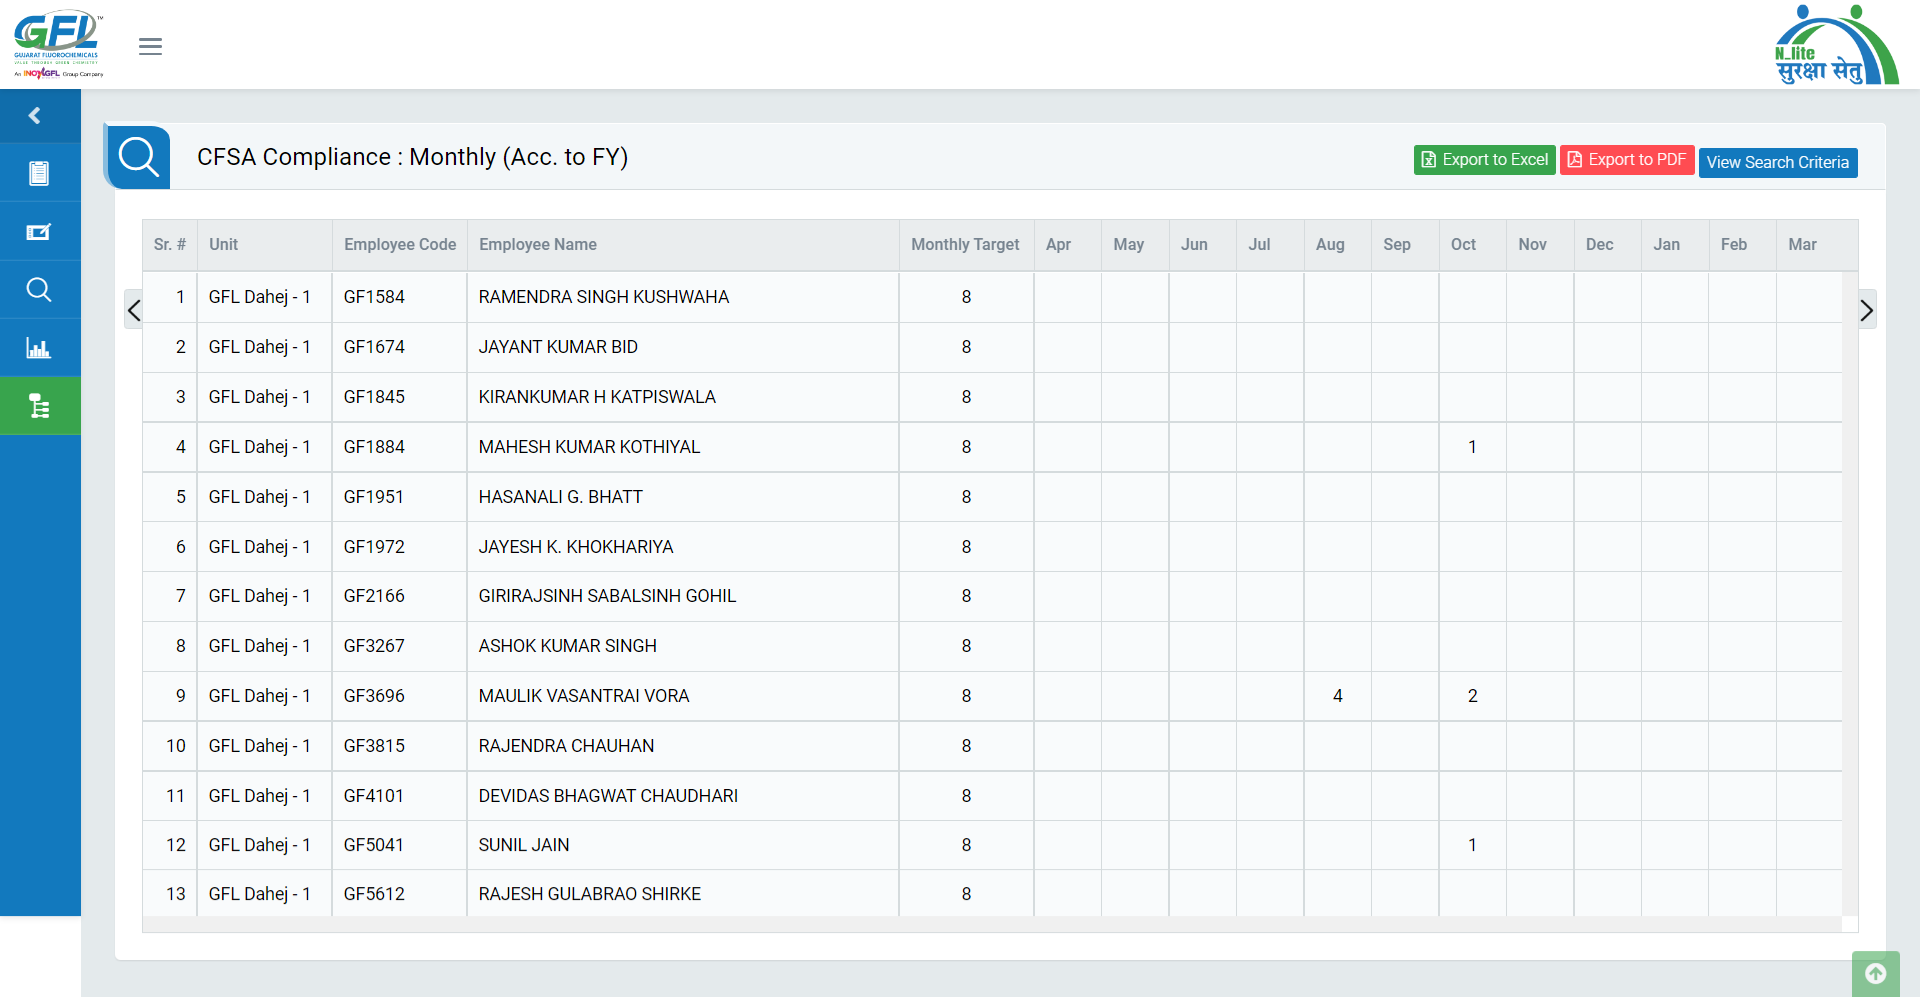
- CFSA Dashboard will fetch details for Timeline, Unit.
- Data for Month wise Targeted CFSA ,Reported CFSA will be populated.